Understanding the Importance of Image Histograms: A Comprehensive Guide
As a passionate photographer, I've come to realize that mastering the art of image histograms is a game-changer. These graphical representations of tonal values within an image may seem daunting at first, but they hold the key to unlocking a world of creative possibilities. In this comprehensive guide, I'll demystify the concept of histograms and share insights on how to leverage their power to elevate your photography skills.
What is an image histogram?
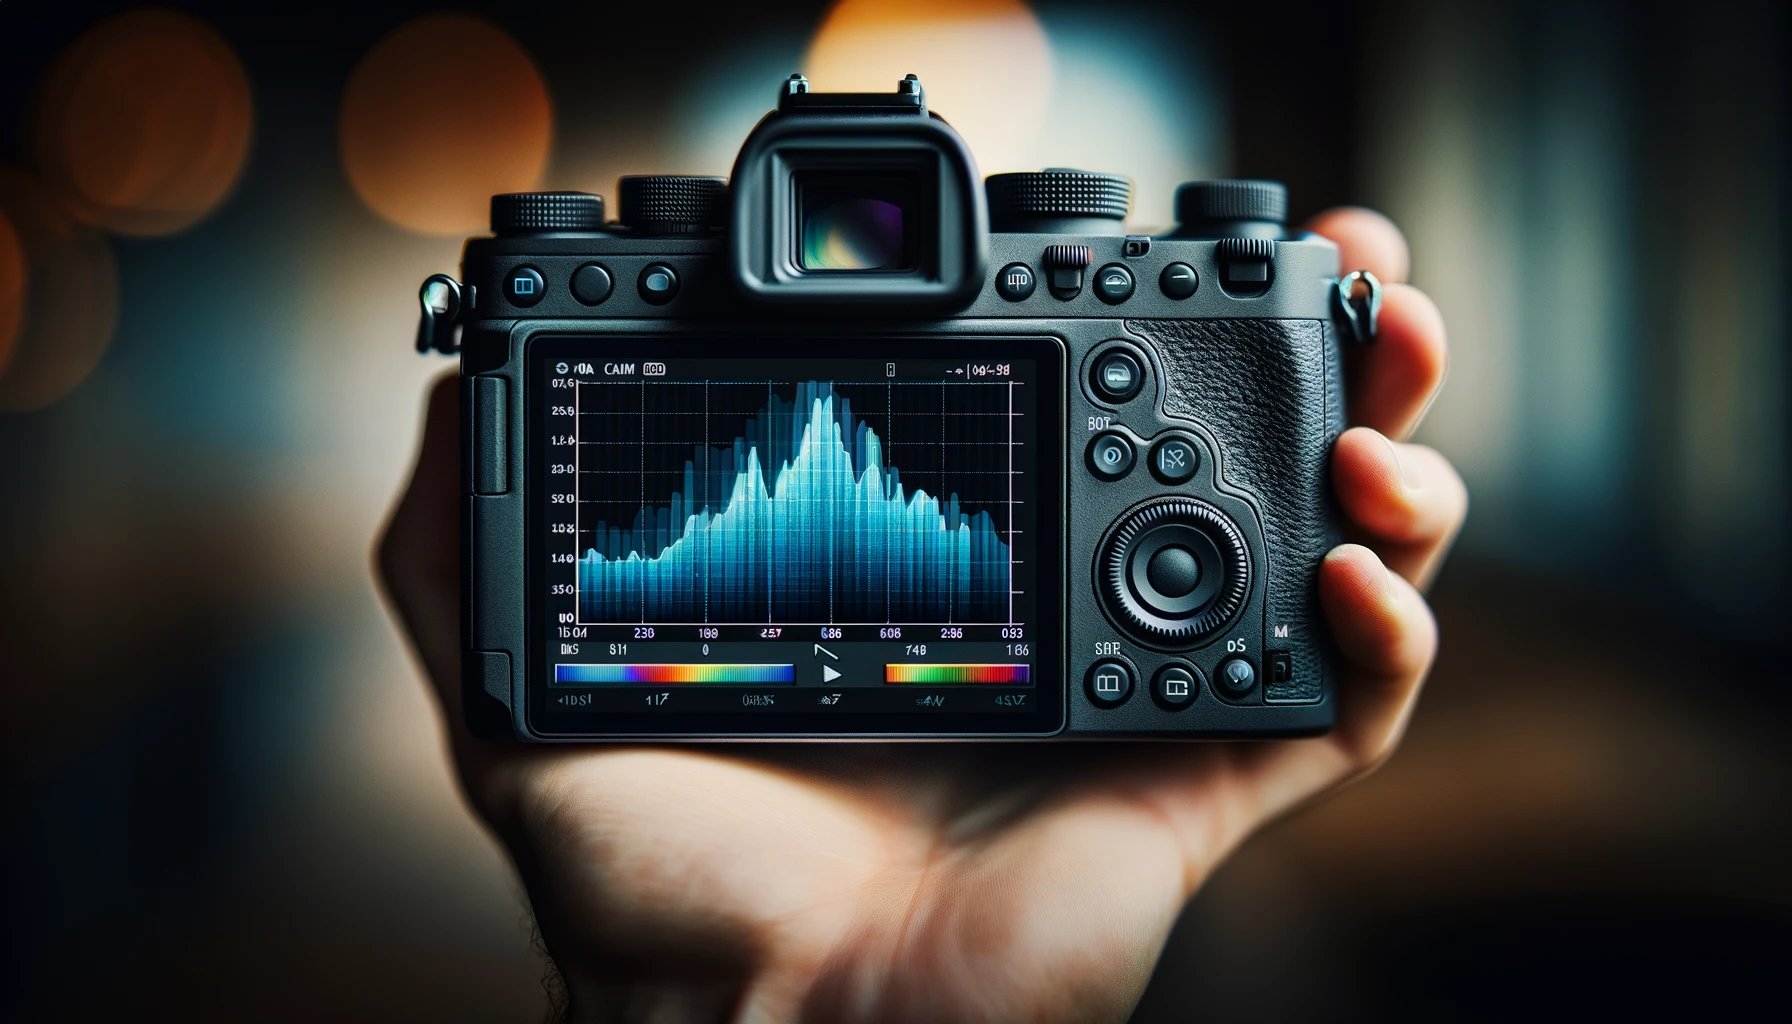
A histogram is a visual representation of the distribution of tonal values in an image. It depicts the number of pixels at each brightness level, from pure black on the left to pure white on the right. Essentially, it's a graph that illustrates the exposure levels within a photograph.
Why are histograms important in photography?
Histograms are crucial in photography for several reasons:
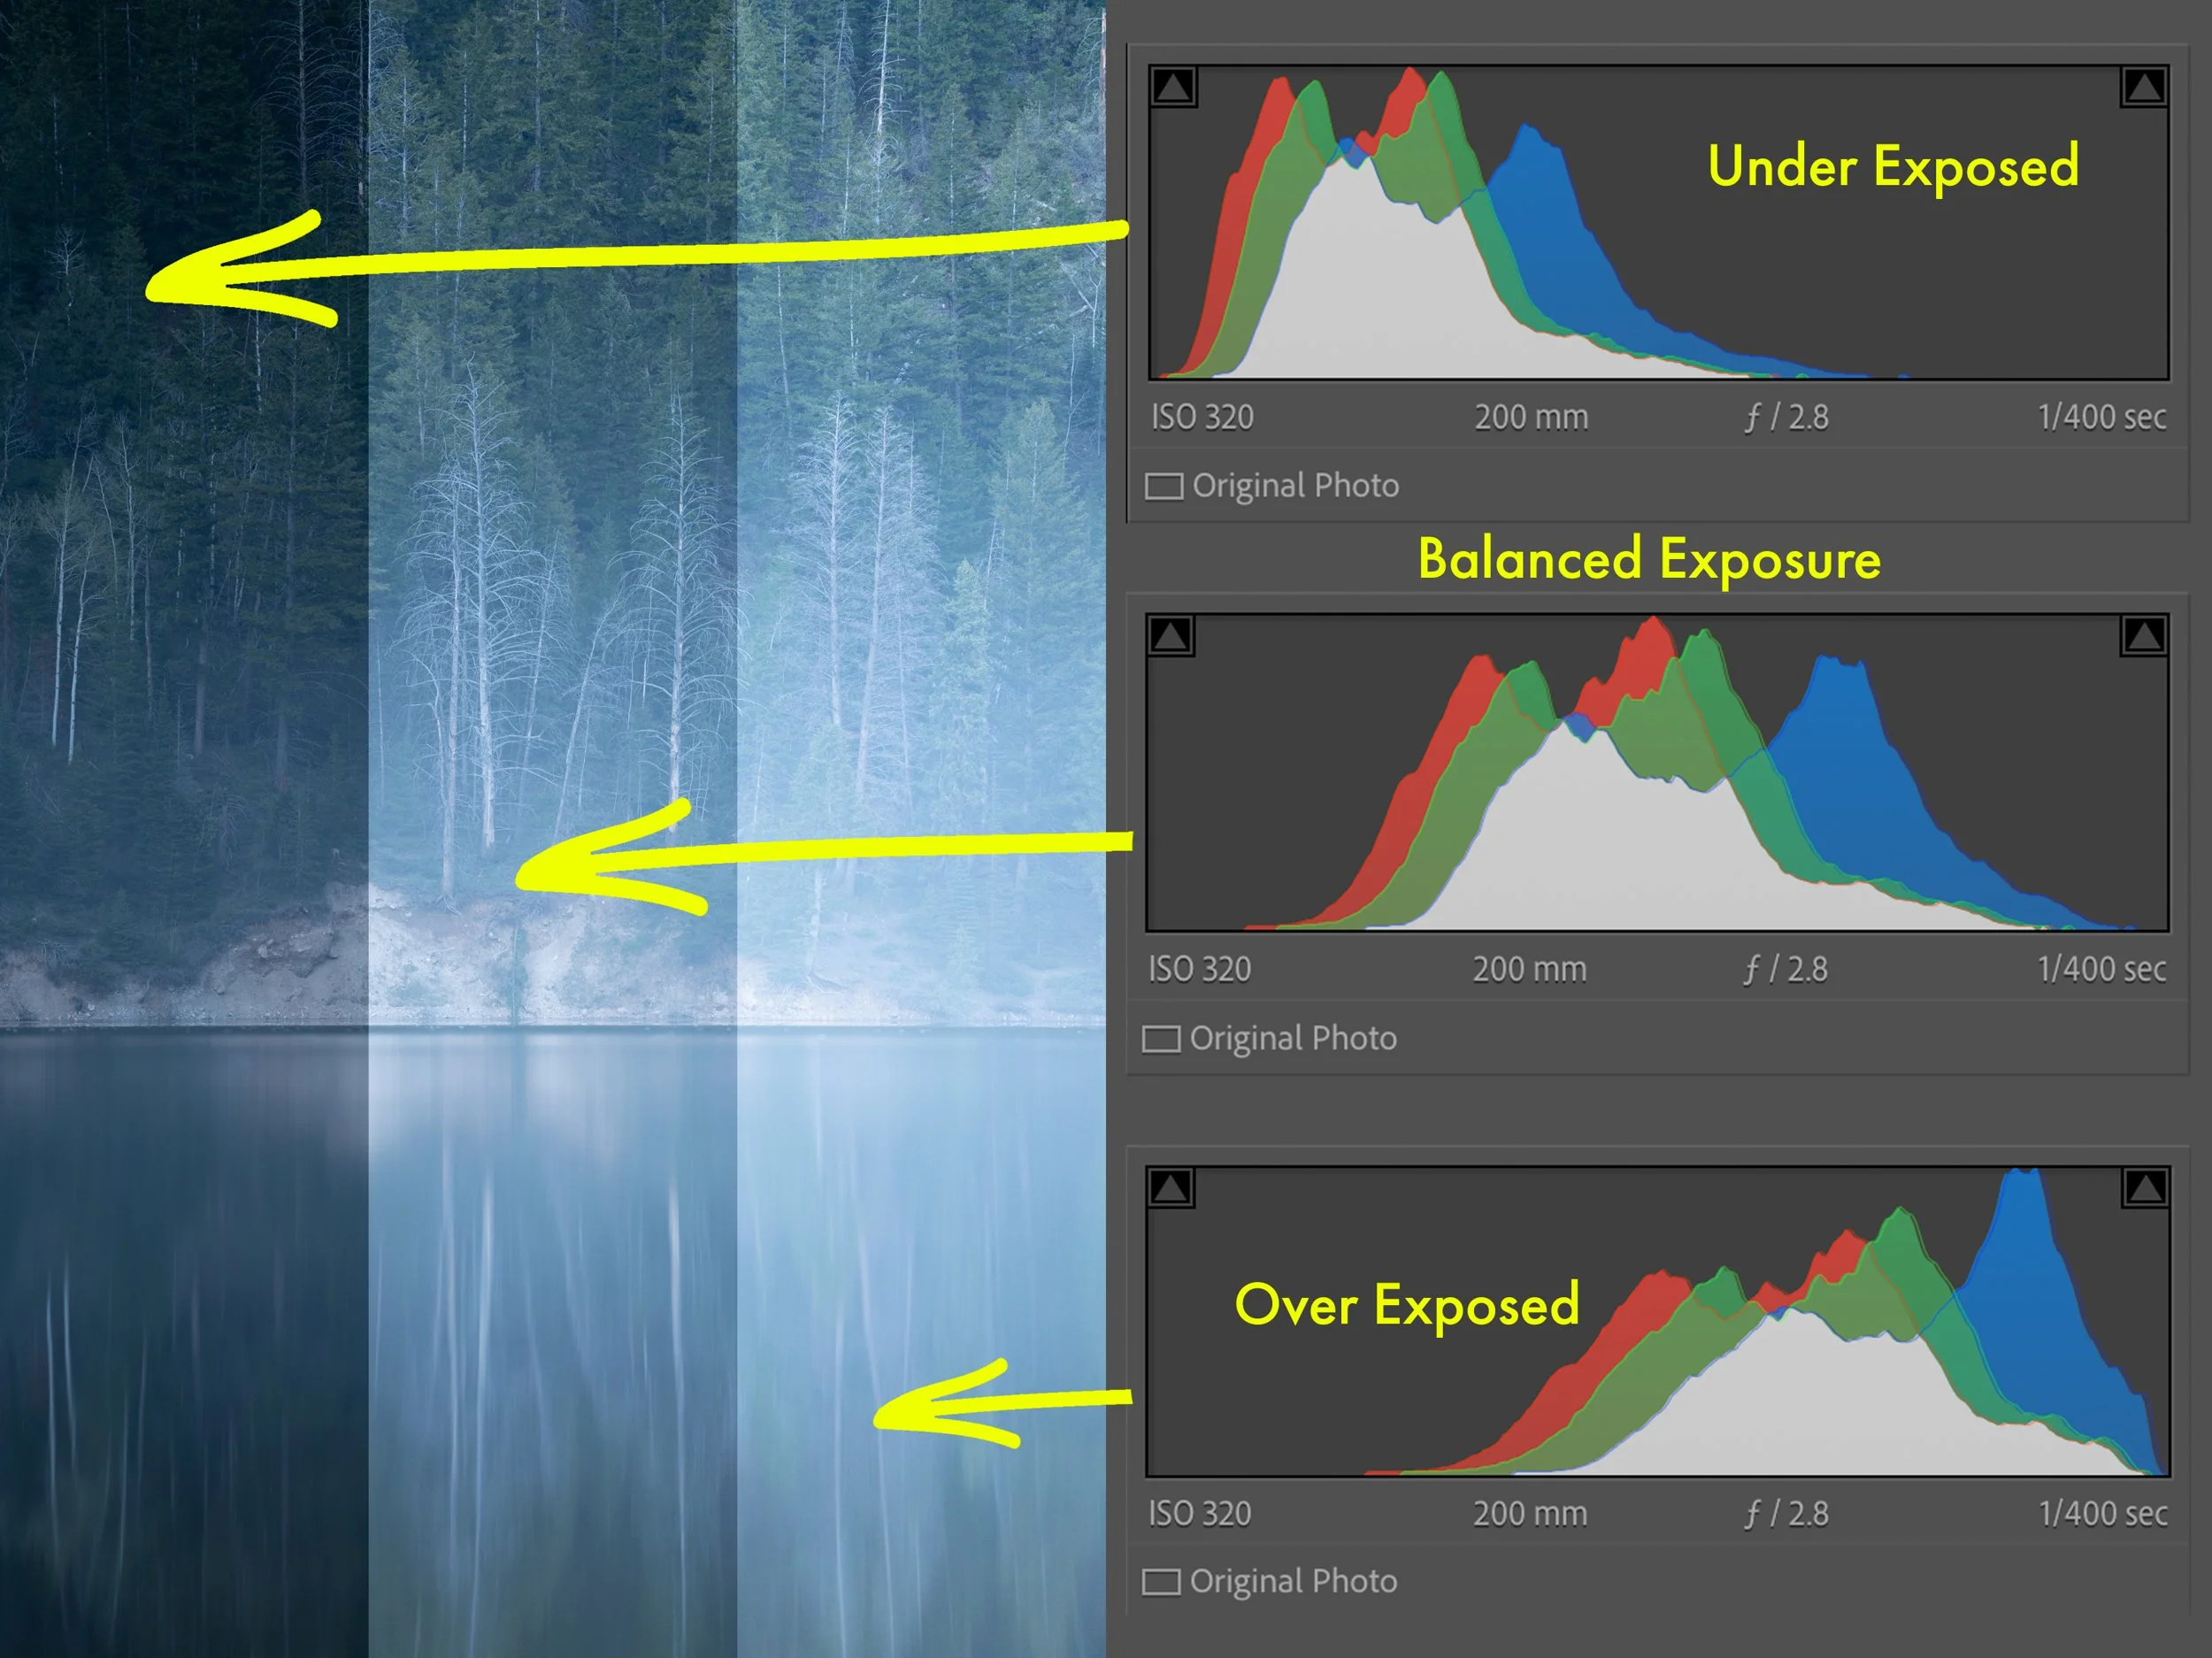
Exposure Evaluation: By examining the histogram, you can quickly assess whether an image is properly exposed, underexposed, or overexposed. This information is invaluable for making informed decisions about adjusting exposure settings or applying post-processing techniques.
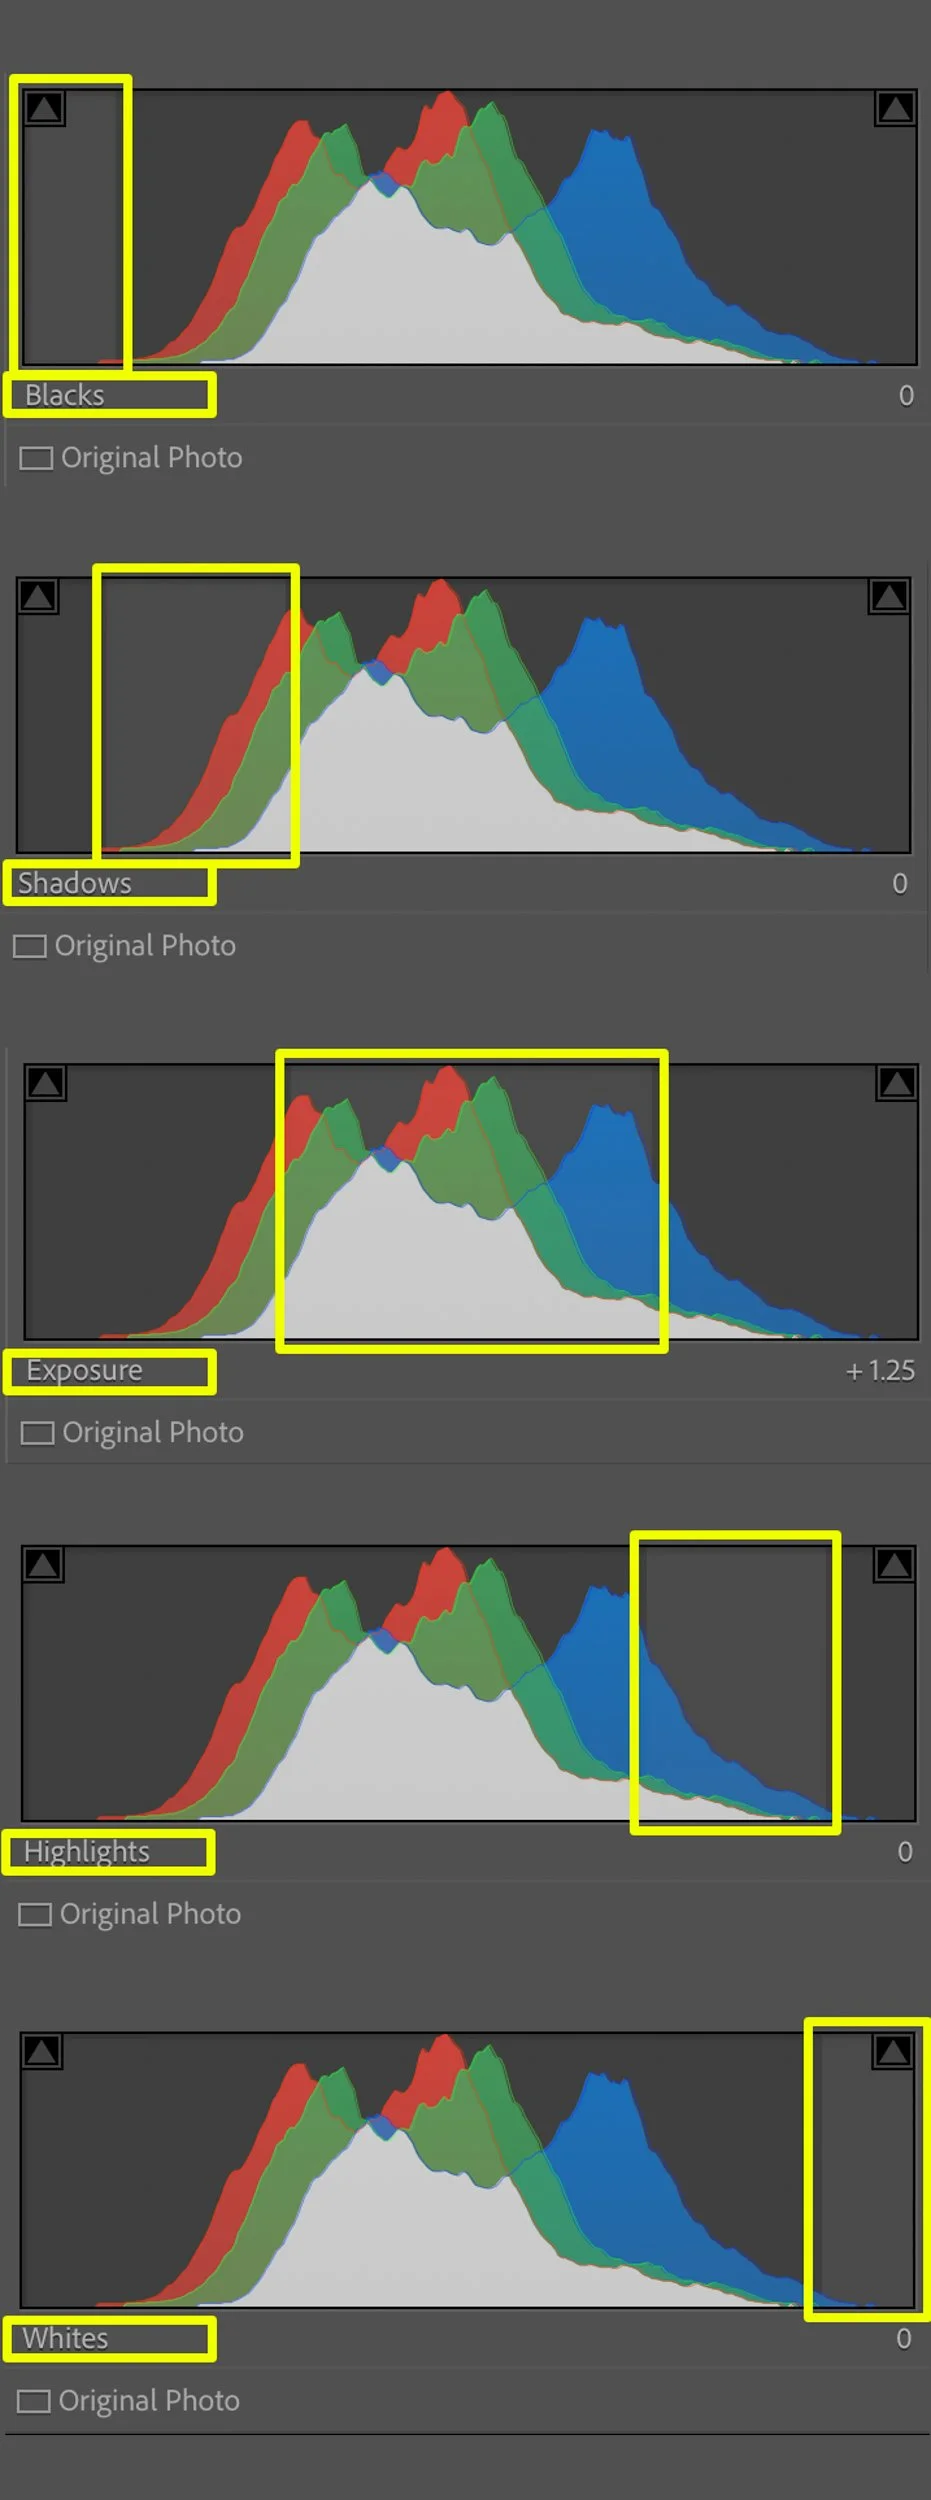
Highlight and Shadow Clipping: The histogram reveals if any details in the highlights or shadows are being clipped or lost, allowing you to make necessary adjustments to preserve crucial details.
Tonal Distribution: The shape and distribution of the histogram provide insights into the overall contrast and tonal range of an image, enabling you to make creative decisions about enhancing or adjusting the tonal qualities.
How to read a histogram
Reading a histogram may seem intimidating at first, but with a little practice, it becomes second nature. Here's a quick breakdown of how to interpret a histogram:
Horizontal Axis: The horizontal axis represents the tonal values, ranging from pure black (0) on the left to pure white (255) on the right.
Vertical Axis: The vertical axis indicates the number of pixels at each tonal value. The higher the peak, the more pixels are present at that particular brightness level.
Shape and Distribution: A well-exposed image typically has a histogram that spans the full tonal range, with a balanced distribution of pixels across the mid-tones and no significant spikes or gaps.
Clipping: If the histogram touches the left or right edge, it indicates clipping in the shadows or highlights, respectively, resulting in lost details.
Understanding the different types of histograms
While the basic principles of reading a histogram remain the same, different types of histograms can provide additional insights:
RGB Histograms: These histograms display the tonal distribution for each individual color channel (Red, Green, and Blue), allowing you to identify and correct color casts or imbalances.
Luminance Histograms: Also known as grayscale histograms, these show the overall brightness levels without separating the color channels, providing a simplified view of the tonal distribution.
Channel Histograms: Some software offers the ability to view histograms for individual color channels, which can be particularly useful for advanced color adjustments or creative effects.
The benefits of using histograms in post-processing
While histograms are invaluable for evaluating exposure during the shooting process, they also play a crucial role in post-processing:
Adjusting Exposure and Contrast: By examining the histogram, you can make informed decisions about adjusting exposure, shadows, highlights, and overall contrast to achieve your desired look.
Recovering Details: If you notice clipping in the highlights or shadows, you can use post-processing tools to recover lost details and restore tonal information.
Creative Editing: Histograms can guide you in applying creative adjustments, such as increasing or decreasing contrast, selectively adjusting specific tonal ranges, or creating unique tonal mappings.
Histograms and exposure: Exploring the "expose to the right" technique
One of the most valuable techniques in digital photography is known as "expose to the right" (ETTR). This approach involves intentionally overexposing your images slightly to capture more data in the highlights, without clipping. By doing so, you can maximize the dynamic range and minimize noise in the shadow areas during post-processing.
To utilize the ETTR technique effectively, you'll need to rely heavily on your histogram. The goal is to shift the histogram as far to the right as possible, without clipping the highlights. This ensures that you're capturing the maximum amount of data, allowing for greater flexibility and control during post-processing.
Common misconceptions about histograms
Despite their usefulness, there are a few common misconceptions about histograms that I'd like to address:
Misinterpreting the Shape: While a well-exposed histogram typically has a balanced distribution, there are exceptions. Some scenes, such as high-contrast scenes or intentionally underexposed or overexposed images, may have histograms that appear skewed or spiked, but that doesn't necessarily mean they're poorly exposed.
Ignoring Creative Intent: Histograms are tools, not rules. Your creative vision should take precedence over adhering to a "perfect" histogram shape. Sometimes, intentionally clipping highlights or shadows can create a desired artistic effect.
Relying Solely on Histograms: While histograms are incredibly valuable, they shouldn't be the only factor in evaluating exposure. Always trust your eyes and consider the overall artistic intent when making exposure decisions.
Using histograms to improve your photography skills
Incorporating histograms into your workflow can significantly enhance your photography skills in several ways:
Exposure Consistency: By consistently checking your histograms, you'll develop a better understanding of exposure and become more adept at achieving consistent results across various shooting scenarios.
Creative Control: Histograms empower you to make informed decisions about exposure and tonal adjustments, allowing you to create images that align with your creative vision.
Learning and Improvement: Analyzing histograms can help you identify areas for improvement and learn from your mistakes, ultimately leading to better photographic skills over time.
Histograms in different photography genres: landscape, portrait, and wildlife
While the principles of reading and using histograms remain consistent across genres, each genre may have its own unique considerations:
Landscape Photography
In landscape photography, histograms are invaluable for capturing the full dynamic range of a scene, especially in high-contrast situations like sunrises or sunsets. Paying close attention to the histogram can help you avoid clipping highlights in the sky or shadows in the foreground.
Portrait Photography
When shooting portraits, histograms can assist in achieving accurate skin tones and ensuring proper exposure for your subject. You may need to pay special attention to the highlights and shadows to avoid losing detail in areas like the face or clothing.
Wildlife Photography
In wildlife photography, histograms can be crucial for capturing fast-moving subjects in challenging lighting conditions. Monitoring the histogram can help you quickly adjust exposure settings to ensure you're capturing as much detail as possible in the animal's fur or feathers.
Conclusion
Mastering the art of reading and utilizing histograms is a transformative skill for any photographer. By understanding the distribution of tonal values within your images, you gain greater control over exposure, contrast, and overall image quality. Whether you're a beginner or a seasoned pro, incorporating histograms into your workflow will undoubtedly elevate your photographic abilities and unlock new creative possibilities.
To further enhance your understanding of histograms and their practical applications, consider enrolling in our comprehensive online course, "Mastering Histograms for Exceptional Photography." This in-depth course will provide you with hands-on exercises, real-world examples, and expert guidance to help you unlock the full potential of histograms in your photography journey.
FAQ: Mastering the Art of Image Histograms
1. What is an image histogram in photography?
An image histogram is a graphical representation of the distribution of tonal values within an image. It displays the number of pixels at each brightness level, ranging from pure black on the left to pure white on the right, helping photographers understand exposure levels.
2. Why are histograms important for photographers?
Histograms are essential because they:
Evaluate Exposure: Help determine if an image is properly exposed.
Detect Clipping: Show if details in highlights or shadows are lost.
Assess Tonal Range: Provide insights into the contrast and tonal distribution of an image.
3. How can I read a histogram effectively?
To read a histogram:
Horizontal Axis: Represents tonal values from black (0) to white (255).
Vertical Axis: Shows the number of pixels at each brightness level.
Shape and Distribution: Look for a balanced distribution across the tonal range. Clipping occurs if the histogram touches the left (shadows) or right (highlights) edge.
4. What types of histograms should I be aware of?
RGB Histograms: Display the tonal distribution for Red, Green, and Blue channels.
Luminance Histograms: Show overall brightness without separating color channels.
Channel Histograms: Allow viewing of individual color channels, useful for advanced adjustments.
5. How do histograms help in post-processing?
Histograms aid in post-processing by:
Adjusting Exposure and Contrast: Guide decisions on exposure, shadows, highlights, and contrast.
Recovering Details: Help identify and recover lost details in highlights or shadows.
Creative Editing: Assist in making creative adjustments to tonal ranges and applying unique effects.


